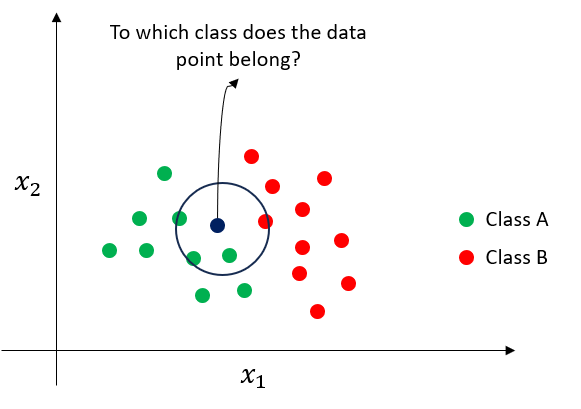
The k-nearest neighbours (kNN) algorithm is a simple universal approximator used for regression and classification that bases its prediction scheme on the majority vote of k neighbours.
The 2D classification example in the above figure illustrates the prediction methodology of kNN. In the two class datasets, the class of a given test data point will depend on the majority votes of its k neighbours. In the current example, given k=4, the major vote of data points estimates that the test data point belongs to class A. Similarly, for a regression problem, the prediction of a data point is estimated as the average of the target values of its k-nearest neighbours.
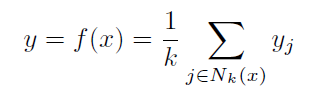
kNN regression estiomation formula
Despite its simplicity, the kNN algorithm yields good predictive results in several case studies. The biggest dilemma is the optimal choice of k which is often selected by guided experimentation (i.e. hyperparameter tuning).
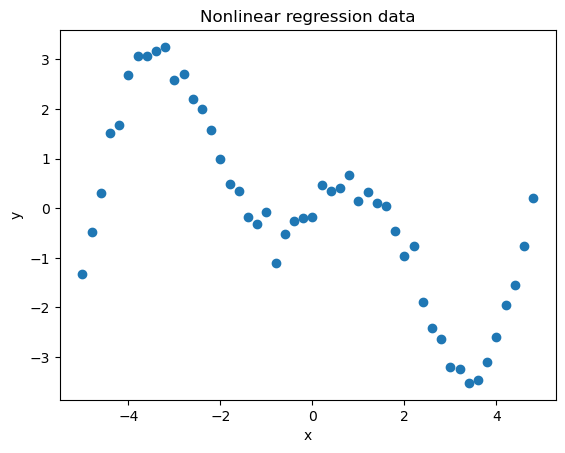
Nonlinear regression using kNN - Python Implementation
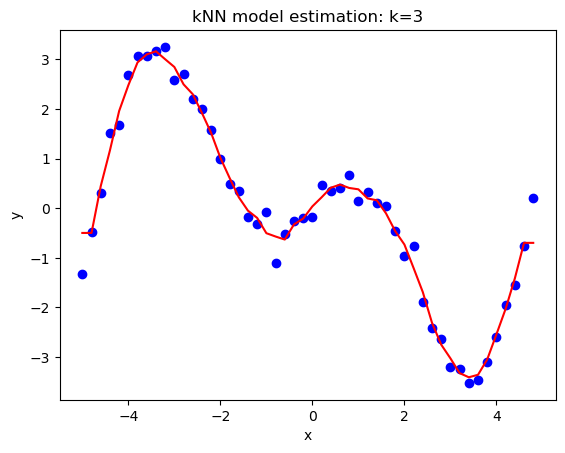
As an universal approximator, kNN can be used to estimate nonlinear relationship in data. In the example, a 2D nonlinear dataset will be used to illustrate the use of the algorithm for regression.
import pandas as pd
import matplotlib.pyplot as plt
import warnings
warnings.filterwarnings('ignore') #ignore warnings
df = pd.read_csv('https://raw.githubusercontent.com/mlinsights/freemium/main/datasets/regression-analysis/1d_nonlinear_regression_data.csv')
df.head()
plt.figure() #plotting the data
plt.scatter(df['x'],df['y'])
plt.xlabel('x')
plt.ylabel('y')
plt.title('Nonlinear regression data')
from sklearn.neighbors import KNeighborsRegressor
x = df[['x']]
y = df[['y']]
k = 3 #number of neighbors
knn_regressor = KNeighborsRegressor(n_neighbors=k) #kNN model configuration
#fit the model
knn_regressor.fit(x,y)
#predict the observation data
y_pred = knn_regressor.predict(x)
plt.figure()
plt.scatter(x,y,color="blue")
plt.plot(x,y_pred,color="red")
plt.xlabel('x')
plt.ylabel('y')
plt.title('kNN model estimation: k=%d'%(k))
plt.show()
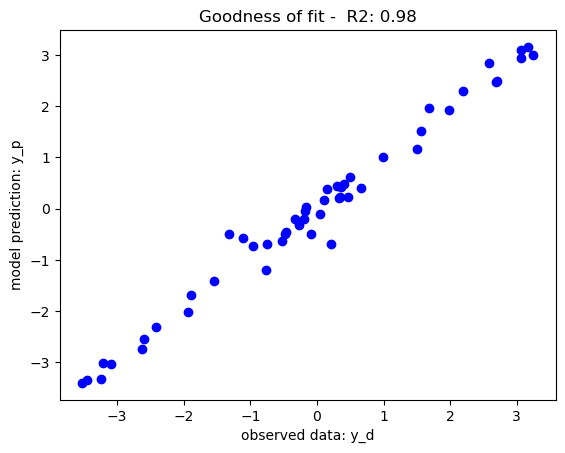
#Goodness of fit test
from sklearn.metrics import r2_score
r2_score_m = r2_score(y_pred,y)
plt.figure()
plt.scatter(y, y_pred, color="b")
plt.xlabel('observed data: y_d')
plt.ylabel('model prediction: y_p')
plt.title('Goodness of fit - R2: %.2f'%r2_score_m)
plt.show()
Classification using kNN - Python Implementation
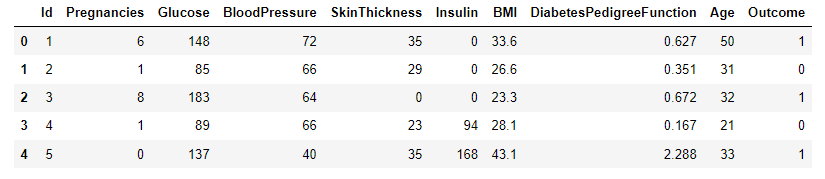
A sample dataset for diabetes classification [1] will be used to test the performance of kNN as a binary classifier. Data were extracted from 2768 patient records with mixed data of healthy and non-healthy patients inclusive of nine attributes:
Id: Unique identifier for each data entry.
Pregnancies: Number of times pregnant.
Glucose: Plasma glucose concentration over 2 hours in an oral glucose tolerance test.
BloodPressure: Diastolic blood pressure (mm Hg).
SkinThickness: Triceps skinfold thickness (mm).
Insulin: 2-Hour serum insulin (mu U/ml).
BMI: Body mass index (weight in kg / height in m^2).
DiabetesPedigreeFunction: Diabetes pedigree function, a genetic score of diabetes.
Age: Age in years.
Outcome: Binary classification indicating the presence (1) or absence (0) of diabetes.
The dataset of records is split into training and test (80/20) to test the predictive performance of kNN in distinguishing between the presence or absence of diabetes. The model will thus be trained on the training set alone but benchmarked on the training and test set. The test performance being the most important has it is an indicator of the model predictive power on unseen data.
import pandas as pd
import matplotlib.pyplot as plt
import seaborn as sns
import numpy as np
import warnings
warnings.filterwarnings('ignore') #ignore warnings
from sklearn.model_selection import train_test_split
from sklearn.metrics import confusion_matrix
from sklearn.metrics import classification_report
from sklearn.neighbors import KNeighborsClassifier
#Load Datasets
df = pd.read_csv('https://raw.githubusercontent.com/mlinsights/freemium/main/datasets/classification/diabetes/Healthcare-Diabetes.csv')
df.head()
#Seperation the features from the target
X = df.iloc[:,1:9]#exclude id in the feature set
y = df[['Outcome']]
#Splitting the Datasets 80/20
X_train, X_test, y_train, y_test = train_test_split(X,y,test_size=0.2,random_state=1234)#fix the random seed (to reproduce the results)
#Building the kNN mmodel
k=5#set number of neighbours
knn_classifier = KNeighborsClassifier(n_neighbors=k)
knn_classifier.fit(X_train,y_train)#train the classifier
#get model prediction on train set and test set
y_pred_train = knn_classifier.predict(X_train)
y_pred_test = knn_classifier.predict(X_test)
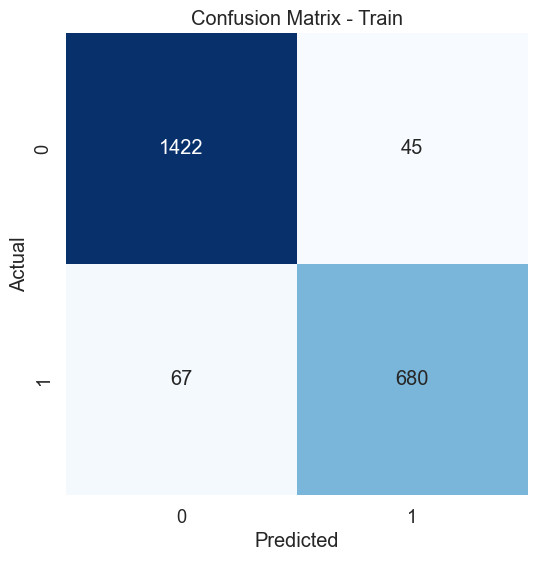
#Assessing the model performance of training set
cm_train = confusion_matrix(y_train, y_pred_train)# Create confusion matrix for the training set
plt.figure(figsize=(8, 6))# Create heatmap - Test set
sns.set(font_scale=1.2)
sns.heatmap(cm_train, annot=True, fmt="d", cmap="Blues", cbar=False, square=True)
plt.xlabel('Predicted')
plt.ylabel('Actual')
plt.title('Confusion Matrix - Train')
plt.show()
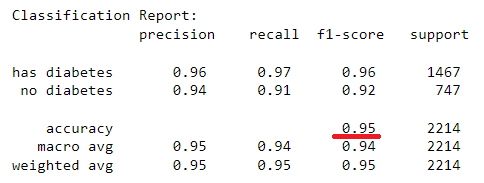
train_report = classification_report(y_train, y_pred_train, target_names=['has diabetes','no diabetes'])
print("Classification Report:\n", train_report)
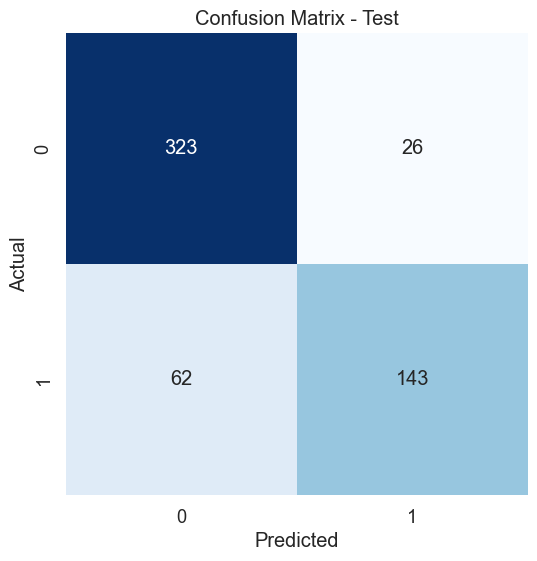
#Assessing the model performance of test set
cm_test = confusion_matrix(y_test, y_pred_test)# Create confusion matrix test set
plt.figure(figsize=(8, 6))# Create heatmap - Test set
sns.set(font_scale=1.2)
sns.heatmap(cm_test, annot=True, fmt="d", cmap="Blues", cbar=False, square=True)
plt.xlabel('Predicted')
plt.ylabel('Actual')
plt.title('Confusion Matrix - Test')
plt.show()
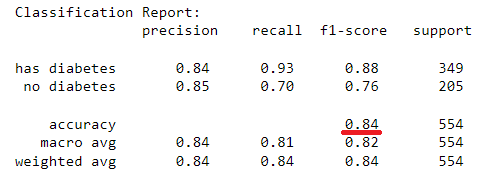
test_report = classification_report(y_test, y_pred_test, target_names=['has diabetes','no diabetes'])
print("Classification Report:\n", test_report)
print("class_acc:",class_acc)
The kNN model with 5 neighbours has yield an in-sample classification accuracy of 95% and an out-of-sample classification accuracy of 84% which tells its predictive accuracy in diagnosing of diabetes. The model performance can be enhanced by further tuning of the optimal k-value for the datasets using hyperparameter tuning. The confusion matrices provide additional insight into the model sensitivity in predicting individual classes (i.e. presence or absence of diabetes) in the dataset. A similar implementation can be done for kNN regression, however, using the coefficient of determination to assess goodness of fit for a regression problem.
Conclusion
kNN is a simple, universal approximator for regression and classification that generates prediction based on the local insight of the neighbour. Despite its simplicity, the kNN algorithm performs well in many classification and regression case studies. To maximise the potential of a kNN prediction algorithm, the choice of k neighbours must be carefully selected using an appropriate technique such as hyperparameter tuning coupled with n-fold cross-validation.